1793: "Velocity & Acceleration vs. Time"
Interesting Things with JC #1793: "Velocity & Acceleration vs. Time"
A car can be moving fast with zero acceleration, while negative acceleration can actually make something speed up. Velocity and acceleration graphs reveal what an object is doing through their slopes, areas, and direction.
Curriculum - Episode Anchor
Episode Title: Velocity & Acceleration vs. Time
Episode Number: 1793
Series: Interesting Things with JC
Host: JC
Audience: Grades 9–12, introductory college, homeschool, lifelong learners
Subject Area: Physics, physical science, mathematics
Primary Topic: One-dimensional motion, velocity, acceleration, motion graphs
Estimated Lesson Time: 35–50 minutes
Episode Length: Under 3 minutes
Learning Objectives
Students will be able to:
Distinguish position, velocity, speed, and acceleration.
Interpret velocity-versus-time and acceleration-versus-time graphs.
Explain why constant velocity produces zero acceleration.
Determine acceleration from the slope of a velocity-time graph.
Determine displacement from the signed area under a velocity-time graph.
Determine change in velocity from the signed area under an acceleration-time graph.
Explain why negative acceleration does not necessarily mean an object is slowing down.
Connect position-time, velocity-time, and acceleration-time representations of the same motion.
Lesson Overview
This lesson introduces the relationship among position, velocity, acceleration, and time through the motion of a car. Students begin with a counterintuitive observation: a vehicle traveling 60 mph can have an acceleration of exactly zero.
The lesson then connects physical motion to graphical representations. The central mathematical relationship is that slope moves from position toward acceleration, while signed area moves back toward position:
Slope of position vs. time → velocity.
Slope of velocity vs. time → acceleration.
Signed area under acceleration vs. time → change in velocity.
Signed area under velocity vs. time → displacement.
OpenStax presents the same graphical progression in its treatment of one-dimensional motion, including deriving velocity from position graphs and acceleration from velocity graphs. OpenStax
Essential Question: How can a graph reveal not only where an object is moving, but how its motion itself is changing?
Common Misconception: Negative acceleration always means slowing down.
Correction: Whether an object speeds up or slows down depends on the signs of both velocity and acceleration. When velocity and acceleration have the same sign, speed increases; when their signs oppose one another, speed decreases. Physics Classroom
Key Vocabulary
Position: An object's location relative to a chosen reference point.
Distance: Total path length traveled; a scalar quantity.
Displacement: Change in position, including direction: Δx = x₂ − x₁.
Speed: How quickly distance is traveled; a scalar quantity.
Velocity: Rate of change of position or displacement with time, including direction.
Acceleration: Rate at which velocity changes with time.
Slope: Change in the vertical variable divided by change in the horizontal variable.
Area under a graph: The geometrical area between a plotted function and the horizontal axis; in motion graphs its physical meaning depends on the variables plotted.
Positive direction: The direction arbitrarily defined as positive for a particular problem.
Negative direction: Motion or acceleration opposite the chosen positive direction.
Constant velocity: Motion in which velocity does not change with time.
Constant acceleration: Motion in which velocity changes by equal amounts during equal time intervals.
Key Equations
Average velocity: v = Δx / Δt
Average acceleration: a = Δv / Δt
Constant-acceleration velocity: v = v₀ + at
OpenStax gives acceleration as Δv/Δt and, for constant acceleration, velocity as v = v₀ + at. OpenStax
Narrative Core
A car can move down a highway at 60 mph, about 97 km/h, while having zero acceleration. The reason is simple but important: acceleration does not measure how fast something is moving. It measures how quickly its velocity changes.
On a velocity-time graph, constant velocity produces a horizontal line because velocity remains unchanged as time passes.
If the driver presses the accelerator and velocity increases, the line slopes upward. The slope represents acceleration. A steeper slope represents a larger magnitude of acceleration. The Physics Classroom similarly identifies the slope of a velocity-time graph as acceleration. Physics Classroom
The graph contains another layer of information. The signed area between a velocity-time graph and the time axis represents displacement. Physics Classroom
Acceleration-time graphs continue the pattern. Their signed area represents the change in velocity.
This creates a useful chain:
Position → slope → Velocity → slope → Acceleration
And in the reverse direction:
Acceleration → signed area → Change in Velocity → signed area → Displacement
The signs matter. Positive and negative do not automatically mean faster and slower. They indicate direction relative to the coordinate system.
An object moving with negative velocity and negative acceleration is becoming faster in the negative direction. That is why interpreting motion requires considering velocity and acceleration together.
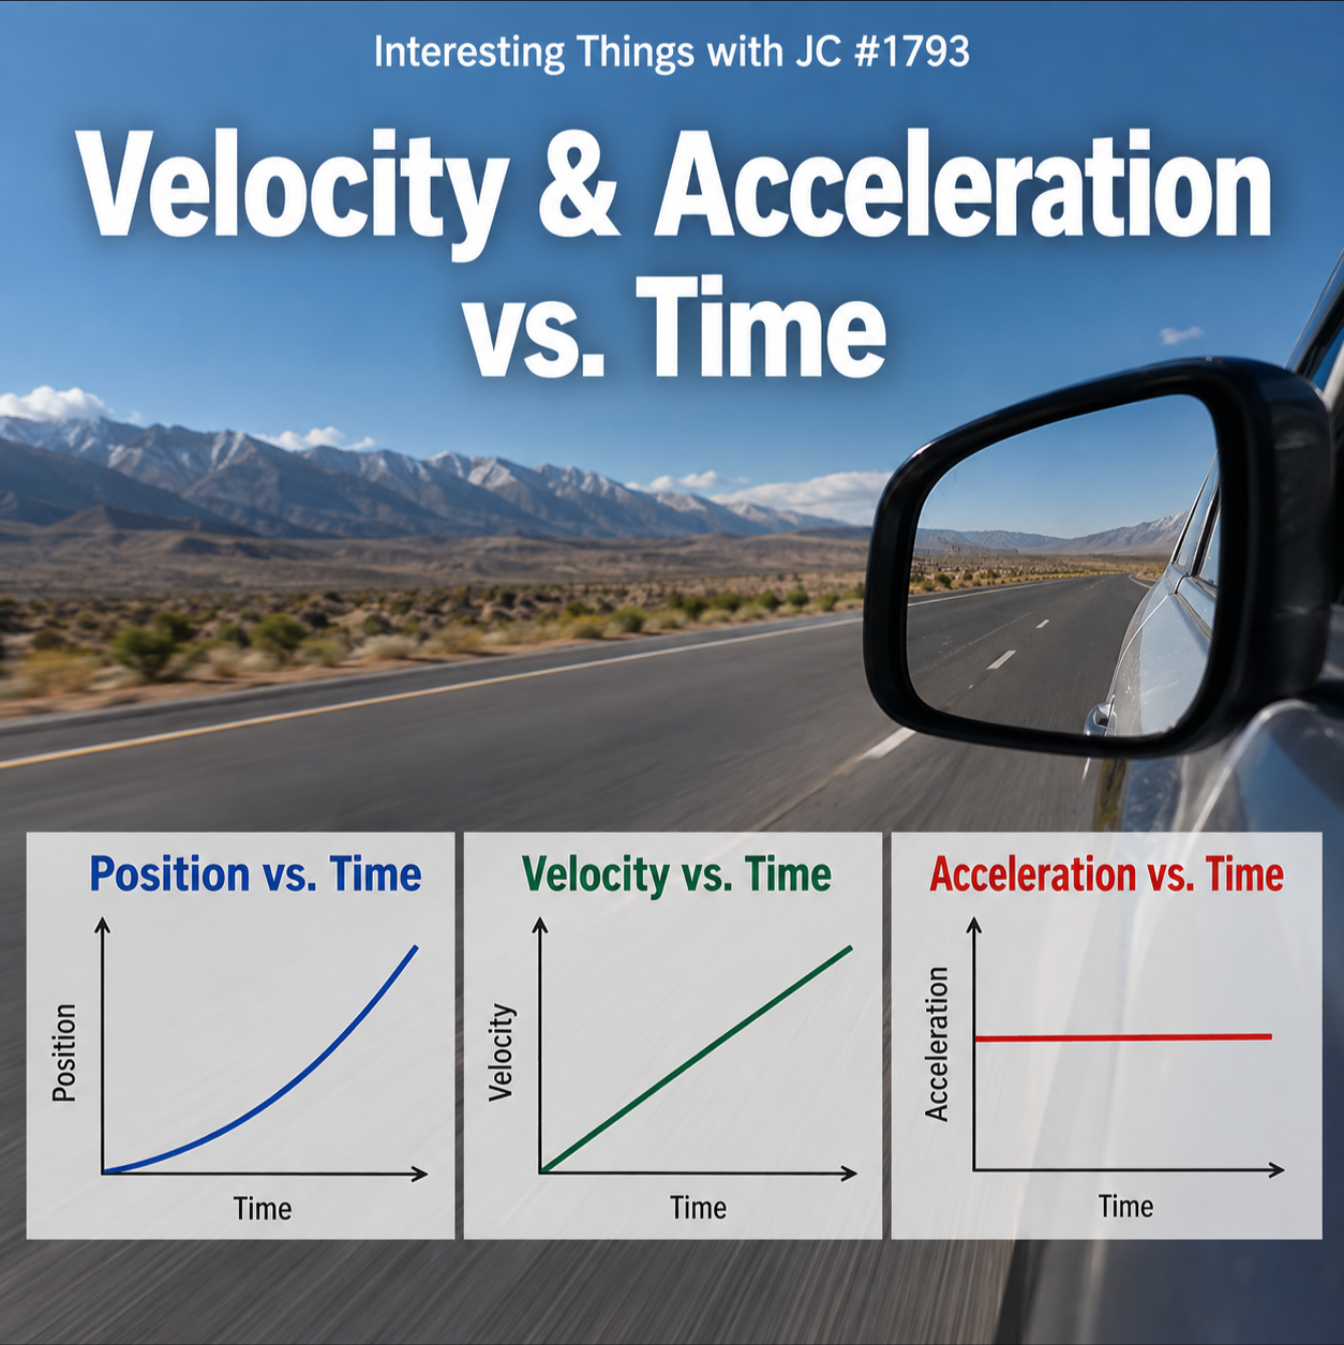
Photograph-style educational podcast cover showing a car traveling on an open highway with mountains in the distance and the roadway visible in the side mirror. Text reads “Interesting Things with JC #1793” and “Velocity & Acceleration vs. Time.” Three diagrams illustrate position, velocity, and acceleration plotted against time.
Transcript
Interesting Things with JC #1793:
"Velocity & Acceleration vs. Time"
Imagine a car traveling down a straight road at 60 miles per hour. The speedometer barely moves. You’re covering distance, but in one important sense, nothing is changing.
That distinction is the key to understanding velocity and acceleration.
Velocity describes how quickly position changes with time, including direction. Travel east at a constant 60 miles per hour, or 97 kilometers per hour, and your velocity stays constant. On a velocity-versus-time graph, that appears as a horizontal line.
The area underneath that line represents displacement. Travel at 60 miles per hour for half an hour, and you’ve moved 30 miles, or 48 kilometers.
Now press the accelerator.
If your velocity increases from 0 to 60 miles per hour in 10 seconds, the graph slopes upward. That slope represents acceleration: how quickly velocity changes with time.
Acceleration is measured in meters per second squared. An acceleration of 2 meters per second squared means velocity increases by 2 meters per second every second.
But acceleration doesn’t necessarily mean speeding up, and negative acceleration doesn’t necessarily mean slowing down. If velocity and acceleration point in opposite directions, the object slows down. If they point in the same direction, even if both are negative, it speeds up.
An acceleration-versus-time graph takes this one step further. A line above zero means positive acceleration. A line at zero means velocity isn’t changing. A line below zero means negative acceleration.
And the area under an acceleration graph gives you the change in velocity.
That connects the three graphs.
The slope of position versus time gives velocity. The slope of velocity versus time gives acceleration. The areas work backward: acceleration gives a change in velocity, while velocity gives a change in position.
Position tells you where you are. Velocity tells you how your position is changing. Acceleration tells you how that change itself is changing.
These are interesting things, with JC.
Student Worksheet
Comprehension
What does velocity describe?
What does acceleration describe?
What does a horizontal line on a velocity-time graph indicate?
What physical quantity is represented by the slope of a velocity-time graph?
What does the signed area under a velocity-time graph represent?
What does the signed area under an acceleration-time graph represent?
Analysis
A car travels east at a constant 20 m/s for 10 seconds. What is its acceleration?
How much displacement occurs during those 10 seconds?
A vehicle's velocity changes from 10 m/s to 30 m/s in 5 seconds. Calculate its average acceleration.
An object has a velocity of −8 m/s and an acceleration of −2 m/s². Is its speed increasing or decreasing? Explain.
An object has a velocity of +8 m/s and acceleration of −2 m/s². Is its speed increasing or decreasing?
A velocity-time graph crosses the horizontal axis from positive velocity to negative velocity. What has happened to the object's direction of motion?
Graph Challenge
Sketch a velocity-time graph for an object moving at constant +10 m/s for 5 seconds.
Sketch a velocity-time graph for an object beginning at rest and accelerating uniformly in the positive direction.
Sketch an acceleration-time graph corresponding to Question 14.
Explain what the slope of your velocity graph represents.
Explain what the area under your velocity graph represents.
Reflection
Why is the statement "negative acceleration means slowing down" incomplete?
Explain the relationship among position, velocity, and acceleration without using equations.
Why can a car moving at highway speed have zero acceleration?
Student Output: Completed responses, calculations with units, and three labeled motion graphs.
Academic Integrity Guidance: Students should show calculations and explain graph interpretations in their own words rather than submitting equations without reasoning.
Teacher Guide
Quick Start: Play the episode once without interruption. Before replaying it, ask students whether a car traveling at exactly 60 mph can have zero acceleration. Record responses before introducing the graph relationships.
Pacing Guide — Audio First
0–5 minutes: Pose the 60 mph/zero-acceleration question and collect predictions.
5–8 minutes: Play Episode #1793.
8–15 minutes: Define position, velocity, and acceleration.
15–25 minutes: Draw position-time, velocity-time, and acceleration-time graphs for one motion.
25–35 minutes: Students complete Questions 7–17.
35–45 minutes: Discuss negative velocity and negative acceleration.
45–50 minutes: Exit assessment.
Materials
Episode audio or transcript
Graph paper
Pencil
Calculator
Whiteboard or display
Optional toy car or dynamics cart
Demonstration
Roll a cart across a table at approximately constant velocity, then repeat while increasing its speed.
Ask students to describe what changes among:
Position
Velocity
Acceleration
Then translate each motion into graphs.
Formative Checkpoints
Ask whether a horizontal velocity-time graph means the object is stopped.
Ask what a zero slope on a velocity-time graph means.
Ask whether negative velocity means slowing down.
Ask whether negative acceleration means slowing down.
Ask students to identify displacement from a velocity-time graph.
Misconceptions to Watch
Horizontal velocity-time line = object stopped. Incorrect unless velocity equals zero.
Negative velocity = slowing down. Incorrect.
Negative acceleration = slowing down. Not necessarily.
Speed and velocity are interchangeable. Incorrect because velocity includes direction.
Area under a velocity-time graph = distance traveled. Not always. Signed area gives displacement; total distance requires accounting for direction changes separately.
Differentiation
Additional Support: Begin with positive-direction motion before introducing negative velocity.
Advanced Learners: Introduce instantaneous velocity and acceleration as derivatives and displacement/change in velocity as definite integrals.
English Learners: Pair each vocabulary term with a graph and physical motion rather than relying solely on definitions.
Homeschool: Use a toy car, stopwatch, measuring tape, and hand-drawn graphs to connect observations to mathematical representations.
Quiz
Velocity measures:
A. Position only
B. Change in position with time and direction
C. Change in acceleration
D. Distance without timeAcceleration is:
A. Velocity divided by position
B. Distance traveled
C. Change in velocity divided by change in time
D. Always an increase in speedThe slope of a position-time graph represents:
A. Acceleration
B. Velocity
C. Distance
D. ForceThe slope of a velocity-time graph represents:
A. Position
B. Distance
C. Acceleration
D. MomentumThe signed area under a velocity-time graph represents:
A. Acceleration
B. Displacement
C. Speed
D. ForceA horizontal velocity-time line at +20 m/s indicates:
A. Zero motion
B. Constant positive velocity
C. Increasing acceleration
D. Negative accelerationAn object has velocity −5 m/s and acceleration −3 m/s². Its speed is:
A. Increasing
B. Decreasing
C. Zero
D. Necessarily constantAn object has velocity +10 m/s and acceleration −2 m/s². Initially, its speed is:
A. Increasing
B. Decreasing
C. Constant
D. UndefinedVelocity changes from 5 m/s to 25 m/s in 4 seconds. What is the average acceleration?
A. 4 m/s²
B. 5 m/s²
C. 6 m/s²
D. 20 m/s²In one sentence, explain why negative acceleration does not automatically mean slowing down.
Answer Key
B
C
B
C
B
B
A
B
B
Accept answers explaining that speeding up or slowing down depends on the relationship between the directions/signs of velocity and acceleration.
Assessment
Performance Task: Students receive a written description of a vehicle that begins at rest, accelerates forward, travels at constant velocity, slows to a stop, reverses direction, and then increases speed while moving backward.
Students must:
Sketch a qualitative position-time graph.
Sketch the corresponding velocity-time graph.
Sketch the corresponding acceleration-time graph.
Identify intervals of positive, zero, and negative acceleration.
Identify where the vehicle changes direction.
Explain when the vehicle is speeding up and slowing down.
Explain how slope connects the three representations.
Assessment Rubric
4 — Advanced: Graphs are mutually consistent; signs, slopes, direction changes, and acceleration are correctly interpreted; explanation clearly connects all three graph types.
3 — Proficient: Graphs are substantially correct with minor errors; student correctly explains the principal slope and area relationships.
2 — Developing: Student recognizes basic graph shapes but inconsistently interprets slope, sign, or direction.
1 — Beginning: Student cannot reliably connect graphical representations to physical motion.
Mastery Target: Level 3 or higher, with correct identification of the distinction between negative acceleration and slowing down.
Standards Alignment
NGSS — Science & Engineering Practices
HS-PS2-1 — Analyze data to support the claim that Newton's second law of motion describes the mathematical relationship among net force, mass, and acceleration. This lesson develops the prerequisite ability to interpret and calculate acceleration from changes in velocity before acceleration is connected to force.
Analyzing and Interpreting Data: Students interpret graphical representations of motion and extract physical quantities from slope and area.
Using Mathematics and Computational Thinking: Students calculate velocity, acceleration, displacement, and changes in velocity from quantitative information.
CCSS Mathematics
CCSS.MATH.CONTENT.HSF-IF.B.6 — Calculate and interpret the average rate of change of a function over a specified interval. Students calculate acceleration as the rate of change of velocity and velocity as the rate of change of position.
CCSS.MATH.CONTENT.HSF-IF.C.7 — Graph functions and show key features of the graph. Students construct and interpret motion graphs.
CCSS.MATH.PRACTICE.MP2 — Reason abstractly and quantitatively. Students connect numerical values, graph shapes, units, and physical motion.
CCSS.MATH.PRACTICE.MP4 — Model with mathematics. Students represent physical motion using position-time, velocity-time, and acceleration-time graphs.
CCSS Literacy in Science and Technical Subjects
CCSS.ELA-LITERACY.RST.9-10.7 — Translate quantitative or technical information expressed in words into visual form and translate information expressed visually or mathematically into words. Students convert descriptions of motion into graphs and explain graphs verbally.
CCSS.ELA-LITERACY.RST.11-12.7 — Integrate and evaluate multiple sources of information presented in diverse formats and media. Students integrate the audio explanation, mathematical relationships, and graphical representations.
Career Readiness Competencies
Quantitative reasoning
Graphical literacy
Data interpretation
Mathematical modeling
Evidence-based explanation
Translating technical information between verbal, numerical, and visual forms
Show Notes
A car traveling 60 mph can have zero acceleration, while an object with negative acceleration can actually be speeding up.
Episode #1793 examines how physicists use position, velocity, acceleration, and time graphs to describe motion. Students learn that slope connects position to velocity and velocity to acceleration, while signed area allows information to be recovered in the opposite direction.
Key Concepts: position, displacement, velocity, acceleration, motion graphs, slope, area under a curve, negative acceleration, kinematics
Free curriculum materials available on the website, no login, no paywall.
Watch: https://youtube.com/@interestingthingswithjc
RSS/MP3 & Curriculum: JimConnors.net
References
OpenStax — Physics, 2.3 Position vs. Time Graphs
Explains position-time graphs and the relationship between graph slope and velocity. OpenStax
https://openstax.org/books/physics/pages/2-3-position-vs-time-graphsOpenStax — Physics, 2.4 Velocity vs. Time Graphs
Covers slope and area in velocity-time graphs and their physical interpretation. OpenStax
https://openstax.org/books/physics/pages/2-4-velocity-vs-time-graphsOpenStax — Physics, 3.2 Representing Acceleration with Equations and Graphs
Connects displacement, velocity, acceleration, equations, and graphical representations. OpenStax
https://openstax.org/books/physics/pages/3-2-representing-acceleration-with-equations-and-graphsOpenStax — College Physics 2e, 2.8 Graphical Analysis of One-Dimensional Motion
Provides a more advanced treatment of deriving velocity and acceleration from motion graphs. OpenStax
https://openstax.org/books/college-physics-2e/pages/2-8-graphical-analysis-of-one-dimensional-motionThe Physics Classroom — Velocity-Time Graphs: Determining the Slope
Explains how the slope of a velocity-time graph represents acceleration. Physics Classroom
https://www.physicsclassroom.com/class/1DKin/U1L4d.cfmThe Physics Classroom — Velocity-Time Graphs: Determining the Area
Explains how signed area under a velocity-time graph represents displacement. Physics Classroom
https://www.physicsclassroom.com/class/1DKin/Lesson-4/Determining-the-Area-on-a-v-t-Graph