1790: "Physics: Position vs. Time"
Interesting Things with JC #1790: "Physics: Position vs. Time"
A car moves down a road, stops, or turns around, and a simple position versus time graph records it all, while the slope reveals something the position itself does not.
Curriculum - Episode Anchor
Episode Title: Physics: Position vs. Time
Episode Number: 1790
Host: JC
Series: Interesting Things with JC
Audience: Grades 9–12, introductory college, homeschool, lifelong learners
Subject Area: Physics, physical science, mathematics, graph interpretation
Estimated Audio Runtime: Approximately 2:35–2:45
Central Question: How can a graph showing only position and time reveal an object's velocity, direction of motion, stopping points, and changes in motion?
Core Concept: On a position-versus-time graph, the slope represents velocity. Straight lines represent constant velocity, horizontal lines represent zero velocity, negative slopes represent negative velocity, and changing slope indicates changing velocity. OpenStax describes the slope of a position-time graph as velocity and the slope of a tangent to a curved graph as instantaneous velocity. OpenStax
Learning Objectives
Students will be able to:
Identify time and position axes on a position-versus-time graph.
Interpret positive, negative, and zero slopes physically.
Calculate average velocity from the slope of a position-time graph.
Distinguish position, speed, velocity, and acceleration.
Recognize that changing slope indicates changing velocity.
Use evidence from a graph to describe an object's motion.
Lesson Overview
A position-versus-time graph compresses an object's motion into a visual mathematical representation. Rather than merely recording where an object is, its slope allows students to determine how position changes with time.
For a straight segment:
Average velocity = change in position ÷ change in time
v = Δx / Δt
For example, an object moving from 0 meters to 50 meters in 5 seconds has:
v = (50 m − 0 m) / (5 s − 0 s) = 10 m/s
That is approximately 22.4 mph.
A horizontal position-time line has zero slope and therefore zero velocity. A downward-sloping line represents negative velocity, meaning motion in the direction defined as negative—not “negative speed.” A curved position-time graph has changing slope and therefore changing velocity. OpenStax
Essential Understanding
Students should leave the lesson recognizing that the shape of a graph has physical meaning. They are not simply reading coordinates; they are reconstructing motion.
Common Misconceptions
A higher point on a position graph means an object is moving faster.
A downward line means an object is slowing down.
A horizontal line represents constant velocity rather than zero velocity.
Negative velocity means negative speed.
A curved position-time graph automatically means an object is speeding up.
Crossing position zero means the object stopped.
Key Vocabulary
Position: An object's location relative to a chosen reference point.
Time: The independent variable normally shown on the horizontal axis of a motion graph.
Displacement: Change in position: Δx = x₂ − x₁.
Slope: Rise divided by run; on a position-time graph, change in position divided by change in time.
Velocity: Rate at which position changes with time, including direction.
Average Velocity: Total displacement divided by elapsed time.
Instantaneous Velocity: Velocity at a particular instant; graphically, the slope of the tangent to a position-time curve at that instant. OpenStax
Speed: Magnitude of velocity; unlike velocity, speed does not contain direction.
Acceleration: Rate at which velocity changes with time.
Positive Direction: The direction designated as positive within a coordinate system.
Negative Velocity: Motion in the direction defined as negative.
Tangent Line: A line used to determine the instantaneous slope of a curve at a particular point.
Narrative Core
Imagine watching a car travel along a straight road. At one instant it is beside you. Five seconds later it is 50 meters (164 feet) away. Five seconds after that it is 100 meters (328 feet) away.
The positions tell part of the story. Plotting them against time reveals considerably more.
A straight rising line means position is increasing at a constant rate. Its slope gives the velocity. A steeper positive slope means a larger positive velocity. Flatten the line completely and the object is no longer changing position: velocity is zero.
Tilt the line downward and position decreases with time. The object is moving in the negative direction.
Curve the line and something else changes. The slope is no longer constant. Since slope represents velocity, changing slope means changing velocity.
This relationship allows a student to reconstruct motion without ever seeing the object itself.
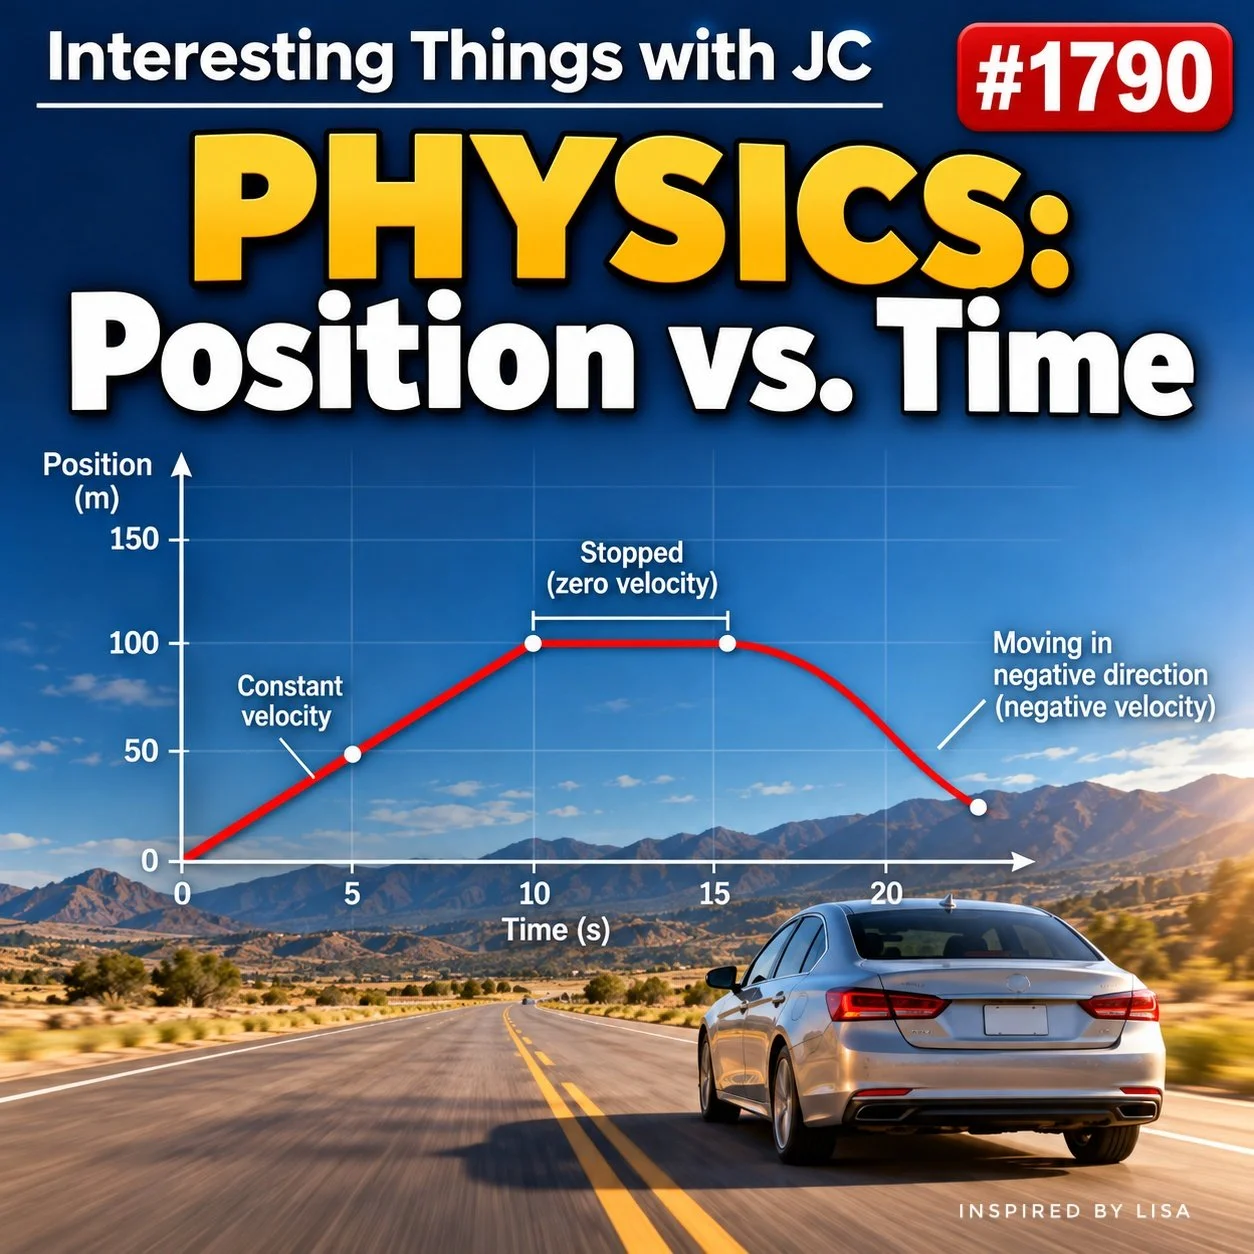
Square educational podcast cover for Interesting Things with JC #1790, “Physics: Position vs. Time.” A silver car travels along a mountain highway beneath a position-versus-time graph. The graph shows increasing position at constant velocity, a horizontal section representing zero velocity, and a downward curve representing motion in the negative direction.
Transcript
Interesting Things with JC #1790:
"Physics: Position vs. Time"
Imagine you're standing beside a straight road watching a car. At noon, it's right in front of you. Five seconds later, it's 50 meters down the road. Five seconds after that, it's 100 meters away.
You could describe all of that with words, but physics has a faster way to see the entire trip at once: a position versus time graph.
Time goes across the bottom. Position goes up and down the side. Plot where the car is at different moments, connect those points, and something useful appears.
The slope of that line tells you the car's velocity.
If the line rises steadily, the car is moving in the positive direction at a constant velocity. The steeper the line, the greater the velocity in that direction. If the line is perfectly horizontal, time is passing but position isn't changing. The car is stopped.
And if the line slopes downward, the car hasn't somehow developed negative speed. It's moving in the opposite direction. Velocity includes direction, so its velocity is negative.
Now let the line curve.
A curve means the slope is changing, and because slope represents velocity, the object's velocity is changing. That's acceleration. Depending on which way the graph curves, the object might be speeding up, slowing down, or changing direction. If the curve reaches a point where its slope is zero, that can mark the instant an object stops before reversing direction.
That's why position versus time is more than a record of where something was. A single graph can show whether something moved, which direction it traveled, whether its velocity remained constant, when it stopped, and whether its motion changed.
And the mathematics behind it is surprisingly familiar. Slope is rise over run. On this graph, that's change in position divided by change in time.
That's velocity.
So when a physics problem hands you a position versus time graph, don't just look at the line.
Look at how it slopes.
These are interesting things, with JC.
Student Worksheet
Comprehension
Which variable appears on the horizontal axis of a position-versus-time graph?
What physical quantity does the slope of a position-time graph represent?
What does a horizontal line indicate about an object's motion?
What does a negative slope tell you?
Why does a curved position-time graph indicate changing velocity?
Graph Reasoning
Consider an object with the following motion:
At 0 seconds: position = 0 meters.
At 5 seconds: position = 50 meters.
At 10 seconds: position = 100 meters.
From 10 to 15 seconds: position remains 100 meters.
At 20 seconds: position = 50 meters.
Calculate the object's average velocity from 0 to 10 seconds.
Describe its motion from 10 to 15 seconds.
Calculate its average velocity from 15 to 20 seconds.
Why is the answer to Question 8 negative?
At which interval is the object stationary?
Analysis
Two objects begin at position zero. Object A's position-time graph is a straight line with a shallow positive slope. Object B's graph is a straight line with a steeper positive slope. Which has the greater velocity? Explain using graph evidence.
A graph is high above the horizontal axis but perfectly flat. Is the object moving quickly because its position is large? Explain.
Can an object have a negative velocity while its position is positive? Explain.
Why does crossing the position axis not necessarily mean an object has stopped?
Explain the difference between being at position zero and having zero velocity.
Reflection
Why might a graph communicate motion more effectively than a list of positions and times?
Describe one real-world situation that could be represented with a position-time graph.
Difficulty Scaling
Level 1: Identify whether graph segments represent positive, negative, or zero velocity.
Level 2: Calculate velocity from straight-line segments.
Level 3: Interpret curved graphs and explain changing instantaneous velocity.
Student Output: Answers should include units for all numerical quantities and evidence from graph slope when explaining motion.
Academic Integrity Guidance: Calculations should show the selected positions, times, changes in each quantity, and resulting units rather than presenting only a numerical answer.
Teacher Guide
Quick Start: Play the episode once without interruption. Ask students what information they believe can be extracted from a position-time graph. Play it again after introducing slope.
Pacing Guide — Audio First
0–5 minutes: Listen to the episode and identify unfamiliar terms.
5–10 minutes: Draw axes labeled position and time and reconstruct the opening car example.
10–20 minutes: Demonstrate positive, zero, and negative slopes.
20–30 minutes: Students calculate velocities from the worksheet data.
30–40 minutes: Introduce curved position-time graphs and tangent slope conceptually.
40–50 minutes: Complete analysis questions and class discussion.
Materials
Graph paper or digital graphing software
Pencil and ruler
Calculator
Stopwatch or smartphone timer for optional demonstration
Measuring tape for optional motion activity
Optional Human Position Graph
Mark a straight path approximately 10 meters (32.8 feet) long. One student walks while another records position every 2 seconds. Graph position against time.
Repeat using:
constant walking speed
standing still midway
walking back toward the starting point
Students should predict the graph before plotting the measurements.
Discussion Prompts
Can two objects occupy the same position while having different velocities?
Can an object be far from the origin while having zero velocity?
What information does slope provide that position alone cannot?
Why must direction be defined before velocity can be called positive or negative?
Formative Checkpoints
Student correctly identifies axes.
Student distinguishes position from velocity.
Student calculates slope with correct units.
Student interprets horizontal slope as zero velocity.
Student recognizes negative slope as negative-direction motion.
Student connects changing slope with changing velocity.
Differentiation
Additional Support: Begin with three graph shapes only: rising, horizontal, and falling.
Advanced Learners: Introduce tangent lines and instantaneous velocity on curved graphs.
English Learners: Pair each vocabulary term with a sketch showing its physical meaning.
Kinesthetic Learners: Have students physically walk motions represented by graphs before calculating slopes.
Quiz
On a standard position-versus-time graph, time is normally plotted on the:
A. vertical axis
B. horizontal axis
C. slope
D. tangentThe slope of a position-time graph represents:
A. acceleration
B. distance
C. velocity
D. forceA horizontal position-time line represents:
A. constant positive velocity
B. increasing speed
C. zero velocity
D. negative accelerationA straight line with a negative slope indicates:
A. negative velocity
B. negative speed
C. zero displacement
D. increasing accelerationAn object's position changes from 20 m to 80 m in 10 s. What is its average velocity?
A. 2 m/s
B. 6 m/s
C. 8 m/s
D. 10 m/sWhy can a curved position-time graph indicate acceleration?
A. Position becomes negative.
B. Time changes.
C. Its slope, and therefore velocity, changes.
D. The object must be moving toward the origin.An object remains at position 200 m for 15 seconds. What is its velocity during that interval?
A. 200 m/s
B. 15 m/s
C. −15 m/s
D. 0 m/sA student says, “The line is going downward, so the object must be slowing down.” What is wrong with the statement?
A. Downward slope indicates negative velocity, not necessarily decreasing speed.
B. Downward slope always means acceleration is zero.
C. Position graphs cannot show direction.
D. Negative slopes are impossible.What mathematical operation is used to calculate average velocity from two points on a position-time graph?
A. Δt / Δx
B. Δx × Δt
C. Δx / Δt
D. x + tA curved graph reaches a point where its tangent is horizontal. What is the instantaneous velocity at that point?
A. maximum
B. zero
C. necessarily negative
D. impossible to determine
Answer Key
B
C
C
A
B — (80 − 20) m / 10 s = 6 m/s
C
D
A
C
B
Assessment
Performance Task
Students create and interpret a position-versus-time graph representing a fictional 30-second journey. Their graph must contain:
one interval of constant positive velocity
one stationary interval
one interval of negative velocity
at least one change in velocity
Students then write a concise physical description of the motion represented.
Assessment Rubric
4 — Advanced: Graph is quantitatively consistent; slopes, directions, stops, and velocity changes are correctly interpreted; calculations include correct units and reasoning.
3 — Proficient: Graph accurately represents the required motions with minor errors that do not affect the central interpretation.
2 — Developing: Student recognizes some graph-motion relationships but confuses position, slope, direction, or velocity.
1 — Beginning: Graph and explanation show limited connection between position, time, and slope.
Mastery Evidence: A proficient student should be able to examine an unfamiliar position-time graph and correctly describe the object's direction and velocity behavior using slope as evidence.
Standards Alignment
NGSS — Physical Science
HS-PS2-1 — Motion and Stability: Forces and Interactions — Students analyze position and velocity information as functions of time. NGSS specifically identifies position- or velocity-versus-time graphs as examples of data that can be analyzed within HS-PS2-1. Next Generation Science Standards
NGSS — Science & Engineering Practices
Analyzing and Interpreting Data — Students extract physical meaning from graphical data, compare slopes across intervals, and use quantitative evidence to characterize motion. NGSS identifies analyzing and interpreting data as the relevant practice for HS-PS2-1. Next Generation Science Standards
Using Mathematics and Computational Thinking — Students use Δx/Δt to convert graphical information into quantitative descriptions of velocity.
CCSS Mathematics
CCSS.MATH.CONTENT.HSF-IF.B.4 — Interpreting Functions — Students interpret key features of graphs in terms of the quantities represented.
CCSS.MATH.CONTENT.HSF-IF.B.6 — Rate of Change — Students calculate and interpret average rate of change over specified intervals. In this lesson, the rate of change of position with respect to time is average velocity.
CCSS.MATH.CONTENT.HSF-LE.A.1 — Linear and Exponential Models — Straight position-time segments reinforce interpretation of constant rates of change.
CCSS Literacy in Science and Technical Subjects
CCSS.ELA-LITERACY.RST.9-10.7 — Integrate Quantitative or Technical Analysis with Information Expressed Visually — Students connect verbal descriptions of motion with graphical representations.
CCSS.ELA-LITERACY.RST.11-12.7 — Integrate and Evaluate Multiple Sources of Information — Students reconcile graphical, quantitative, and verbal representations of the same physical motion.
CCSS.ELA-LITERACY.WHST.9-10.2 / WHST.11-12.2 — Informative/Explanatory Writing — Students explain motion using quantitative evidence and discipline-specific vocabulary.
College and Career Readiness
Interpret quantitative graphical information.
Use units as part of mathematical reasoning.
Translate between verbal, graphical, and mathematical representations.
Support conclusions with measurable evidence.
Bloom's Taxonomy
Remember: Define position, velocity, slope, and acceleration.
Understand: Explain what different graph slopes represent.
Apply: Calculate velocity from graph data.
Analyze: Reconstruct motion from unfamiliar graphs.
Evaluate: Identify incorrect interpretations of motion graphs.
Create: Construct a graph representing specified physical motion.
Universal Design for Learning
Multiple Means of Representation: Audio narrative, equations, graphs, physical demonstrations, and verbal descriptions.
Multiple Means of Action and Expression: Students calculate, graph, explain, or physically demonstrate motion.
Multiple Means of Engagement: Familiar vehicle and walking examples connect abstract graphical reasoning to observable motion.
Show Notes
A position-versus-time graph does much more than show where an object is. Its slope reveals velocity.
In this lesson, students learn how rising, horizontal, falling, and curved lines translate into physical motion. They calculate velocity from slope, distinguish velocity from speed, identify stops and changes of direction, and learn why a curved position-time graph means velocity is changing.
The lesson is designed for high school physics, introductory college physics, homeschool instruction, and independent learners. This episode is dedicated to Lisa Heater, appreciate all you do, and your hard work!
Classroom Use: Free for classroom instructional use with attribution. No resale.
Watch: https://youtube.com/@interestingthingswithjc
RSS / MP3 / Open Curriculum: https://JimConnors.net
References
OpenStax. Physics, Section 2.3: Position vs. Time Graphs. Detailed instructional treatment of position-time graphs, slope, average velocity, curved graphs, and instantaneous velocity. OpenStax
https://openstax.org/books/physics/pages/2-3-position-vs-time-graphsOpenStax. Physics, Chapter 2 Section Summary. Summary of displacement, velocity, position-time graphs, and graphical interpretation of motion. OpenStax
https://openstax.org/books/physics/pages/2-section-summaryOpenStax. University Physics Volume 1, Section 3.2: Instantaneous Velocity and Speed. Provides deeper treatment of extracting instantaneous velocity from position-time graphs using tangent slopes. OpenStax
https://openstax.org/books/university-physics-volume-1/pages/3-2-instantaneous-velocity-and-speedOpenStax. College Physics 2e, Section 2.8: Graphical Analysis of One-Dimensional Motion. Connects position, velocity, acceleration, slope, and graphical analysis. OpenStax
https://openstax.org/books/college-physics-2e/pages/2-8-graphical-analysis-of-one-dimensional-motionNext Generation Science Standards. HS-PS2-1: Motion and Stability — Forces and Interactions. High-school performance expectation and science practice explicitly incorporating position- and velocity-versus-time data. Next Generation Science Standards
https://www.nextgenscience.org/pe/hs-ps2-1-motion-and-stability-forces-and-interactions